Zara Schmitt · 7 October 2026
Artist-Led Initiatives Spotlight Waterfront Environmental Shifts in Willow Bay
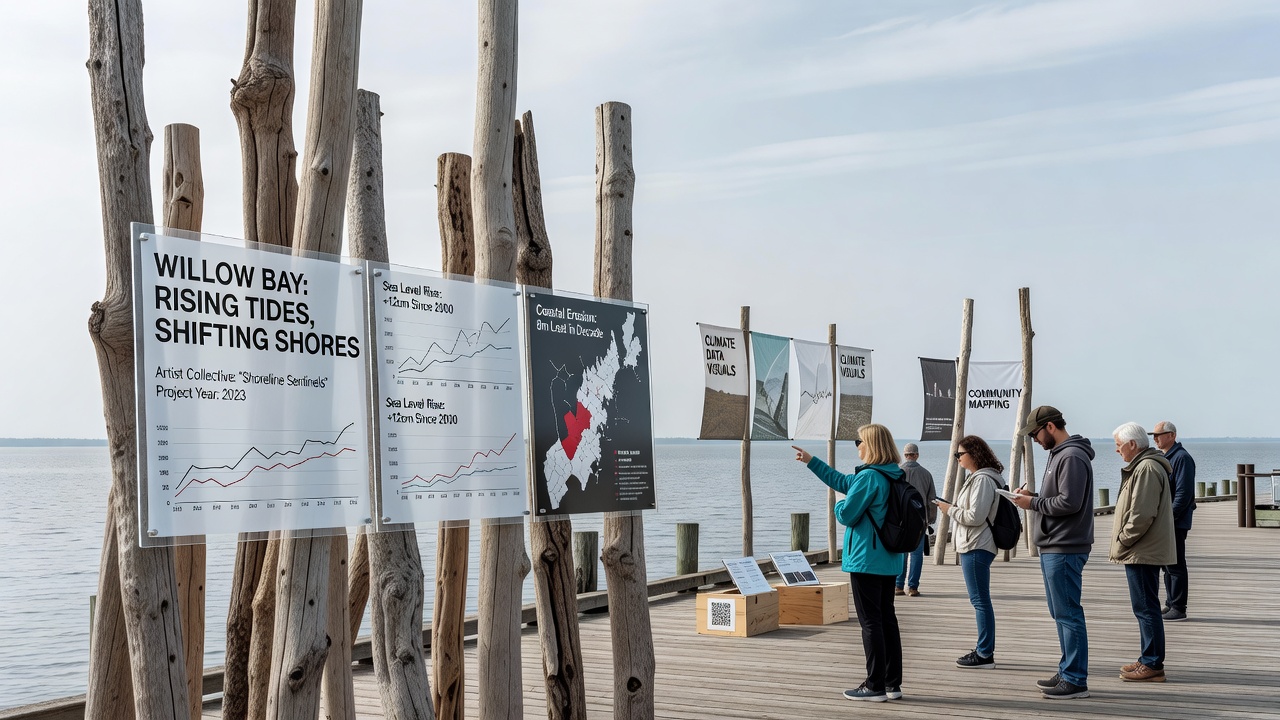
Local artists have developed a series of installations and interactive displays that map measurable environmental alterations along the Willow Bay waterfront, with several projects reaching public view in October 2026. These efforts combine data from monitoring stations with visual and multimedia elements that track shifts in water levels, shoreline erosion, and species distribution over recent decades. One installation incorporates tide gauge readings collected since 2005 and overlays them onto sculptural forms that rise and fall with simulated tidal cycles. Participants walk through the pieces and observe how average high-water marks have moved inland by nearly two feet in that period. Another project uses projected video sequences drawn from satellite imagery to illustrate marshland contraction in the same stretch of shoreline.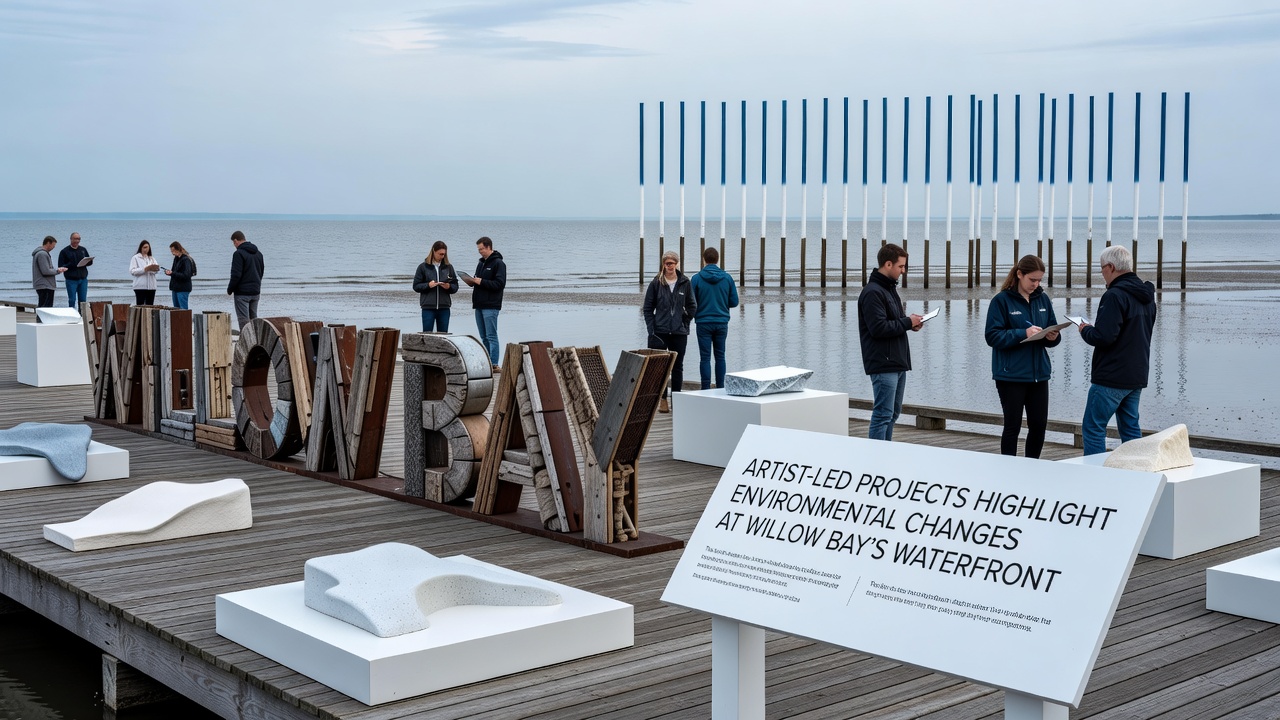
Local artists have developed a series of installations and interactive displays that map measurable environmental alterations along the Willow Bay waterfront, with several projects reaching public view in October 2026. These efforts combine data from monitoring stations with visual and multimedia elements that track shifts in water levels, shoreline erosion, and species distribution over recent decades. One installation incorporates tide gauge readings collected since 2005 and overlays them onto sculptural forms that rise and fall with simulated tidal cycles. Participants walk through the pieces and observe how average high-water marks have moved inland by nearly two feet in that period. Another project uses projected video sequences drawn from satellite imagery to illustrate marshland contraction in the same stretch of shoreline.Project Details and Artist Contributions
Multiple artist teams collaborated with environmental monitoring groups to source raw datasets. They translated salinity measurements, sediment core samples, and bird population counts into physical structures and digital overlays. One team created a series of mirrored panels etched with contour lines that reflect both the current waterline and historical boundaries documented in 1990s surveys. A separate installation features audio recordings of changing tidal flows paired with light displays that activate when sensor data indicates peak erosion periods. These works sit at three primary access points along the waterfront path and remain on view through the end of 2026. Organizers report steady foot traffic, with visitors spending an average of twelve minutes at each station according to on-site counters.Documenting Specific Environmental Indicators
Data incorporated into the projects shows a consistent pattern of increased turbidity during spring runoff months, alongside a measurable decline in native eelgrass beds. Artists rendered these findings as layered translucent fabrics that shift color intensity when viewed under different light conditions, allowing observers to track seasonal variations without requiring technical background knowledge. Temperature loggers placed at fixed intervals supplied information for an interactive map that updates every thirty minutes. Viewers tap the display to see how surface water temperatures have risen an average of 1.8 degrees Fahrenheit since 2010. The same map marks locations where invasive species have established footholds, drawn from annual surveys conducted by regional research vessels.